If you are new to building websites, writing code or just React JS you will need to know how to debug your code. This post shows you the basics on how to debug JavaScript using the Chrome Developer Tools and using the extension React Developer Tools to debug a React website. There’s a few techniques which are useful to know when debugging a React app and I’ll try and cover most of them.
Table of contents
How to open Developer Tools in Chrome
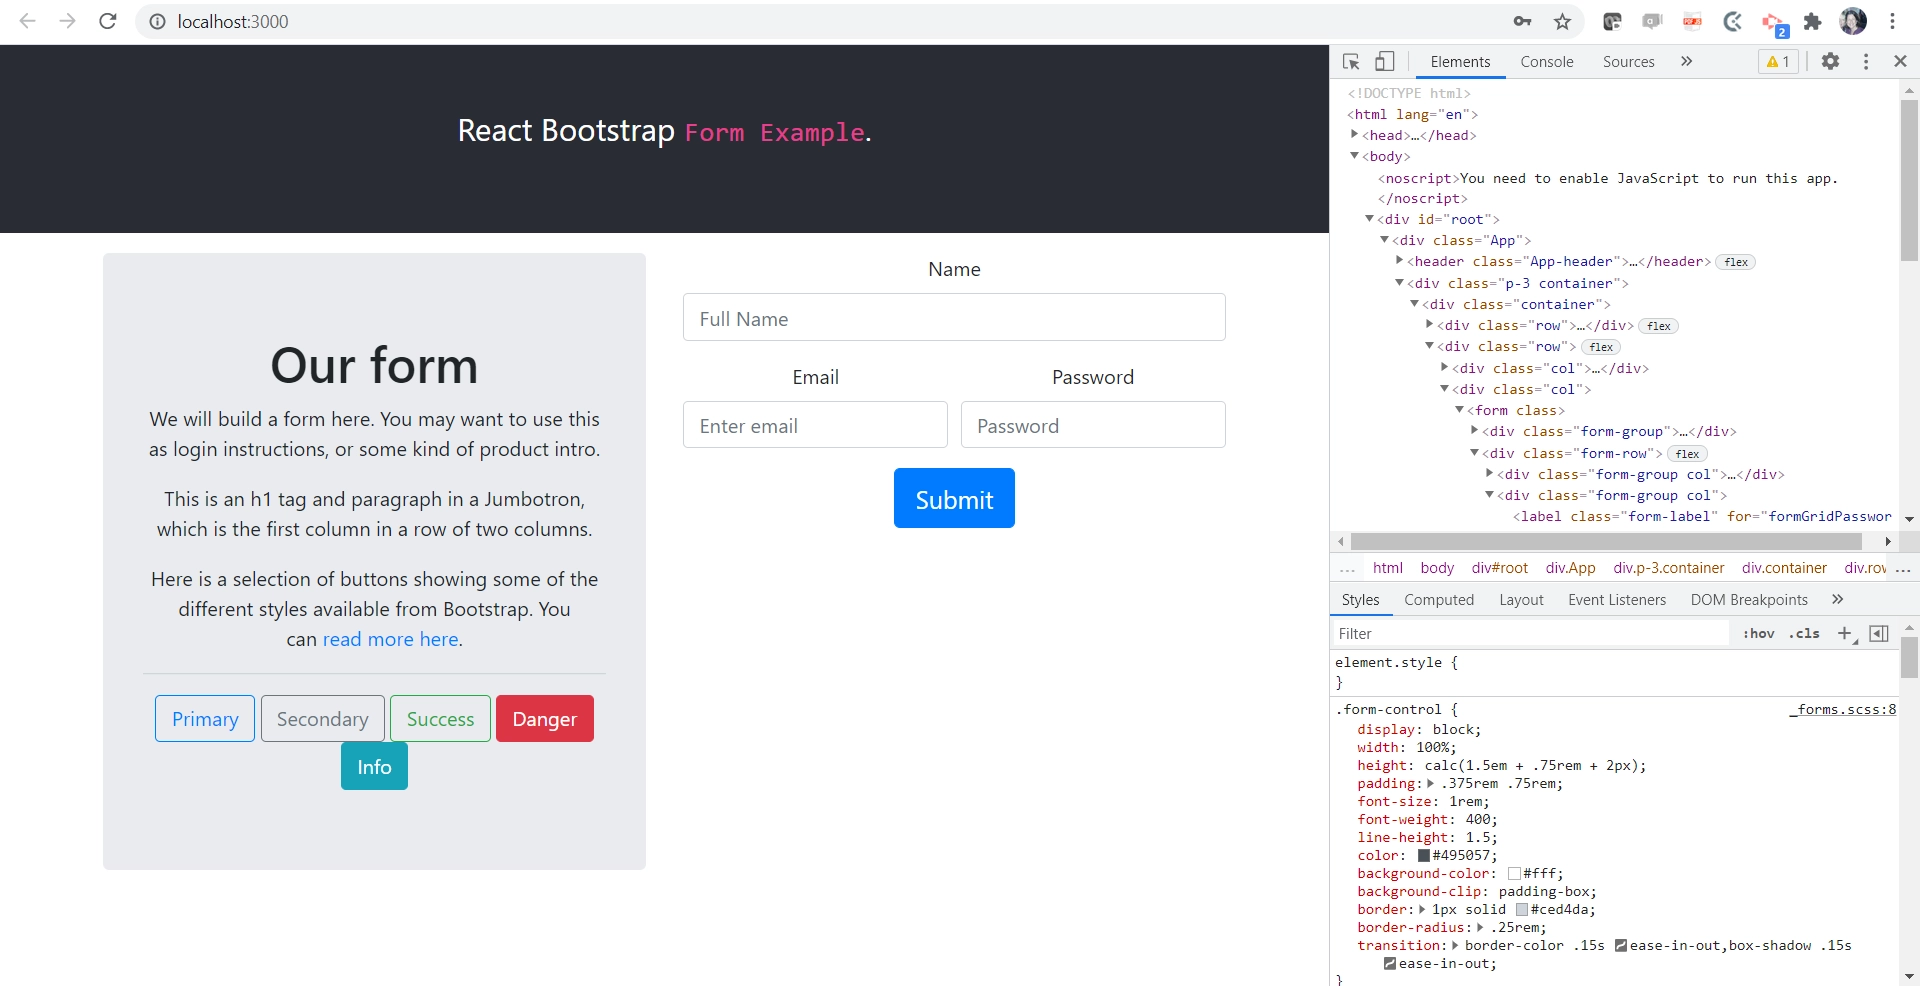
Open VS Code (or your editor of choice) and run your code – npm start – so that you have your website running and ready to debug. I use Chrome for all of my development and debugging, and mostly work on a PC, so I’ll focus on that browser only. Once you are in Chrome, press Ctrl + Shift + I (PC) or Option + Shift + I (Mac). To be more precise, hold down the Ctrl key, and at the same time hold down the Shift key, and at the same time hold down the I key (I for India). You’ll see the Chrome Developer Tools open open up in your browser, either next to your website, or below it, depending on your browser settings. Here’s what mine looks like, with the dev tools show to the right hand side:
Whilst I am focused on how to debug React in Chrome in this blog post, all of the debug techniques described here can be used to learn how to debug for any Javascript based website. The website shown in all of the images are from my Using Bootstrap with React Forms post.
What to use the Chrome dev tools for
Most of the time I use the Chrome dev tools to :
- Inspect elements in the browser using the Chrome element inspector
- Instantly switch css styles on and off
- View debug messages in the console
- Put breakpoints in the JavaScript to help me develop and debug
- Find any JavaScript errors
1. Inspect elements in the browser using the Chrome Element Inspector
With the dev tools open, click the Elements tab at the top of the Dev Tools area, then click the icon which is top left that shows an arrow in a square – once this has been clicked you can move your mouse over your website and clicking on an element will allow you to inspect it, rather than interact with it.
You’ll see the relevant markup highlighted in the html, and you’ll see the appropriate css shown also. I often use this to switch style properties on and off from css classes to check the styling of an element. This short screen recording shows me using the developer tools to do just that.
2. Instantly switch css styles on and off
You can use the Chrome Developer Tools to test changes to your css styles and see instant results, without actually changing the css file itself. You can deselect properties to see how removing them changes the layout, you can add properties, and you can ‘live edit’ things like font size, colors, and layouts.
3. Using debug messages in the Chrome debug console
Another way to debug React JS in Chrome is to use console log messages in your JavaScript to see a message in the console window in Chrome Developer Tools. This is a quick way to see what’s happening in what order, or to see how a value changes through your code.


4. Use breakpoints to debug JavaScript in Chrome
Breakpoints provide a similar benefit to using console messages but are more useful, because whenever a breakpoint has been hit, you can view the Scope at that moment. By Scope, you can see the value of any variable that is ‘in scope’ at that point.
Chrome have a really useful tutorial about the Chrome dev tools too which I’d recommend reading.
Use React developer tools in Chrome
This tool, which is a Chrome extension called React Developer Tools, provides some React specific debugging capabilities. Once it’s installed you will see two new tabs within the Chrome Developer Tools window, called Components and Profiler.
By selecting one of the components in the tree, you can inspect and edit its current props and state in the panel on the right. In the breadcrumbs you can inspect the selected component, the component that created it, the component that created that one, and so on. The Profiler tab allows you to record performance information.
Chrome web store – react developer tools
Other tools to help you debug
I’d recommend setting up linting in your development environment. I use ESLint in VS Code, which is a static code analyser for Javascript, and flags up potential problems as you build. If you don’t use a linter then those problems would show up when you try and use your website in the browser instead – finding them in your development environment is ultimately a time saver.
Summary
In summary, when debugging a React app, use all the tools available to you – console log messages, the built in developer tools in Chrome, and the React developer tools extension. As you use them more you’ll probably find that one tools works perfectly for one type of debugging, and one works better for another scenario. In my opinion being good at debugging is just as important as being a good coder, and taking some time to learn how to figure out how to debug will save you hours of time in the future.
Debug a React Native App
If you are working in react Native, rather than React JS, then you’ll want some debug information specific to that, as it is slightly different I’ll be adding a post about this soon.